data("swiss")Simple Descriptive Statistics

Calculating the Mean and Standard Deviation
Let’s load the swiss dataset.
Let’s print the first few rows
head(swiss) Fertility Agriculture Examination Education Catholic
Courtelary 80.2 17.0 15 12 9.96
Delemont 83.1 45.1 6 9 84.84
Franches-Mnt 92.5 39.7 5 5 93.40
Moutier 85.8 36.5 12 7 33.77
Neuveville 76.9 43.5 17 15 5.16
Porrentruy 76.1 35.3 9 7 90.57
Infant.Mortality
Courtelary 22.2
Delemont 22.2
Franches-Mnt 20.2
Moutier 20.3
Neuveville 20.6
Porrentruy 26.6Mean
We can calculate simple average in R using the function mean()
Let’s calculate the average Agriculture in the swiss dataset (i.e. % of males involved in agriculture as occupation)
mean(swiss$Agriculture)[1] 50.65957We can see further distributional measures with the function summary() (e.g. Minimum, Median, Maximum)
summary(swiss$Agriculture) Min. 1st Qu. Median Mean 3rd Qu. Max.
1.20 35.90 54.10 50.66 67.65 89.70 We can further have a sense of the variation in fertility by looking at the histogram
hist(swiss$Agriculture)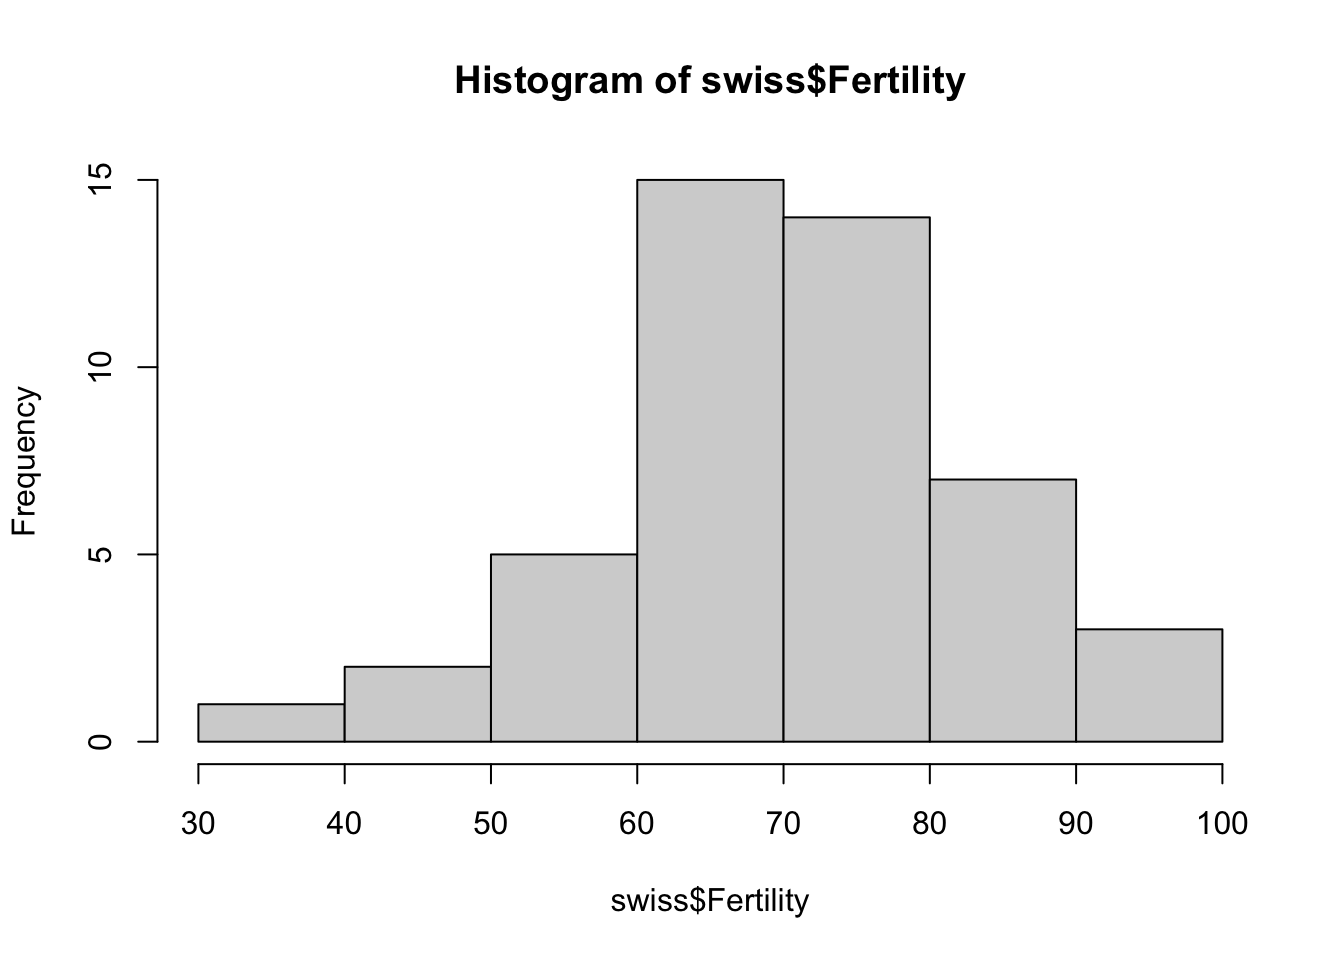
Standard Deviation
The standard deviation is a measure that quantifies the amount of variability or dispersion. It tells us how spread out the values are from the mean (average) of the data set.
The standard deviation can be easily computed with the function sd()
sd(swiss$Agriculture)[1] 22.71122